
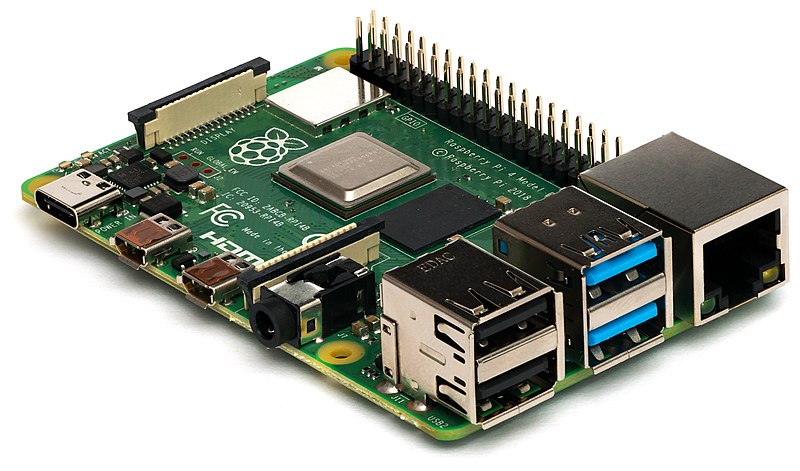
Raspberry Pi Monitoring
20 Apr 2020
In this write-up, I will be explaining the steps required to setup your Raspberry Pi with Grafana, InfluxDB and Telegraf to monitor the system.
Hardware setup that I used:
- Raspberry Pi 4 Model B (Raspbian installed)
So let’s get started…
Step 1: Installing Docker
Docker provides a convenient way to install latest version of Docker into your development environment, we will be using the convenience script today. Although there are other ways to install Docker on Linux destro, this is the only way to install Docker on Rasbian OS.
Note, this script requires root privileges to run successfully. Script will take care of all dependencies and recommendations, and will install the latest version of Docker. The script is available here.
- Let’s download the script and execute it
curl -fsSL https://get.docker.com -o get-docker.sh sudo sh get-docker.sh -
If you wish to run Docker as a non-root user, add your user to
dockergroupsudo usermod -aG docker <your-username> -
Next, let’s install docker-compose, this enables us to define and run multiple docker containers
sudo apt install -y docker-compose -
Now restart your Pi for all changes to take effect
sudo reboot
Step 2: Creating docker-compose file
Now as the title says, we need to setup three things:
- Grafana
- InflucDB
- Telegraf
To make things easier, we will make use of docker-compose instead of setting up each container individually. So, create a file with the following content using nano/ vim or an editor of your choice:
version: '3'
services:
    grafana:
        container_name: grafana
        image: grafana/grafana
        ports:
            - '3000:3000'
        volumes:
            - grafana-storage:/var/lib/grafana
        links:
            - influxdb
        restart: always
    influxdb:
        container_name: influxdb
        image: influxdb
        ports:
            - "8083:8083"
            - "8086:8086"
        volumes:
            - influxdb-storage:/var/lib/influxdb
        restart: always
    telegraf:
        container_name: telegraf
        image: telegraf
        volumes:
            - /var/run/docker.sock:/var/run/docker.sock
            - /proc:/host/proc
            - ${PWD}/conf/telegraf/telegraf.conf:/etc/telegraf/telegraf.conf
            - /opt/vc:/opt/vc:ro
        devices:
            - "/dev/vchiq"
        environment:
            LD_LIBRARY_PATH: /opt/vc/lib
        network_mode: host
        restart: always
volumes:
    influxdb-storage:
    grafana-storage:
Let me explain to you a bit about the above content.
version: states docker-compose file versionservices: list of services that we wish to define and run using this filecontainer_name: name of the container that will be created for respective services, this will be useful later to run commands likedocker logs <container_name>image: docker image used to create containerports: port combination used by our host and container.8080:80states that host’s port 8080 is mapped with container’s port 80, that is, all the traffic of host’s port 8080 will be routed to container’s port 80volumes: paths of the host’s system that are used by container to have a persistent storage, when container is killed or restarted. Here we have used a named volumeinfluxdb-storage, this must be mentioned in the top-levelvolumeskey as welllinks: way to make the container accessible by its alias, such ashttp://influxdb:8063devices: way to bind a available device on host machine to containerenvironment: environment variables required and used by containernetwork_mode: states that container should use host system’s network, this doesn’t isolate container’s and host’s network which is the default behaviourrestart: states when should container be restartedvolumes: top-level key used to list the named volumes defined and used by the services
Step3: Configuring Telegraf
Telegraf is a plugin-driven server-agent that helps you collect all the necessary stats of a system, databases and/or sensors that you wish to monitor. Not only does it collect this data, but also sends this data to a database and/or cloud server to be stored.
Let’s configure it now, instead of creating the config file from scratch we will edit the existing file, to make things easier. To do so, we need to get this file from the docker image itself. First we will create a directory to store this file as mentioned in the docker compose file ${PWD}/conf/telegraf/telegraf.conf.
mkdir -p conf/telegraf
docker run --rm telegraf telegraf config > ./config/telegraf/telegraf.cong
Now, open this file. Beware! don’t be intimidated by the lines of code this file has. It’s well over 6.5K! But, don’t worry, we are concerned with not more than 50 lines.
So, open this file in nano/vim or an editor of your choice, and search for [[outputs.influxdb]].
You will have to uncomment some lines and make some edits. So that this section looks similar to the following:
[[outputs.influxdb]]
  urls = ["http://127.0.0.1:8086"]
  database = "telegraf"
  timeout = "5s"
  username = "telegraf"
  password = "<passowrd>"

  ## HTTP User-Agent
  user_agent = "telegraf"

  ## UDP payload size is the maximum packet size to send.
  udp_payload = "512B"
Now, add the following lines to it. If you wish to maintain the consistency of the file, search for [[inputs.temp]], and add these lines below it.
# # Read cpu temperature from file
[[inputs.file]]
   files = ["/sys/class/thermal/thermal_zone0/temp"]
   name_override = "cpu_temperature"
   data_format = "value"
   data_type = "integer"

 # # Get gpu temperature from VidoeCore general command service
[[inputs.exec]]
   commands = [ "/opt/vc/bin/vcgencmd measure_temp" ]
   name_override = "gpu_temperature"
   data_format = "grok"
   grok_patterns = ["%{NUMBER:value:float}"]

# # Get ARM clock frequency from VideoCore general command sevice
[[inputs.exec]]
  commands = ["/opt/vc/bin/vcgencmd measure_clock arm"]
  name_override = "cpu_clock"
  data_format = "grok"
  grok_patterns = ["=%{NUMBER:value:float}"]

# # Get GPU clock frequency from VideoCore general command sevice
[[inputs.exec]]
  commands = ["/opt/vc/bin/vcgencmd measure_clock gpu"]
  name_override = "gpu_clock"
  data_format = "grok"
  grok_patterns = ["=%{NUMBER:value:float}"]
Step 4: Launch the containers
Go ahead and bring up the containers to life with docker-compose -d up.
If everything goes right you should see the following:
Creating influxdb ... done
Creating telegraf ... done
Creating grafana  ... done
Step 5: Configuring InfluxDB
We need to create a user for Telegraf to interact with InfluxDB. Make sure that password used in this command is same as the one mentioned in telegraf.conf file.
  docker exec -it influxdb influx
> use telegraf
> create user telegraf with password '<password>' with all privileges
After running first line docker exec -it influxdb influx, your prompt should turn to > indicating that the command ran successfully.
Step 6: Configuring Grafana
Now head over to your browser, and navigate to Grafana’s address, or if you are doing this on local machine, then navigate to http://localhost:3000.
Go ahead and sign in. Use username as admin and password as admin. On next page you will be asked to change the default password. It is highly recommended that you do so.
Next, go to Settings > Data Sources, and click on Add Data Sources.
You should be presented with list of databases to configure as data sources. Select InfluxDB, listed under Time series databases.
On the next page set fields as mentioned below:
- URL: http://influxdb:8086
- Database: telegraf
- User: telegraf
- Password: enter password set for user
telegraf
Note: Username and password must be same as that used while creating user in InfluxDB in the earlier command create user telegraf with password '<password>' with all privileges.
Now, click on Save & Test. You should get a green pop-up saying your data source is working. Now you are all set. All you have to do is create, or import a dashboard to monitor your system.
Step 7: Adding a Dashboard
Now, let’s create your own dashboard. But wait, why reinvent the wheel! Hence, I imported a dashboard from Grafana.com. Select a dashboard that suits your needs, copy the dashboard ID to your clipboard.
Now, head to Dashboard > Manage, click on the Import button. Paste the dashboard ID in the input field labeled Grafana.com Dashboard and click anywhere outside the field and wait for a while. Now, you will be presented with some new fields to edit. Select InfluxDB for the dropdown labeled influxdb and click on Import. That’s it, you should be presented with the dashboard you chose.
You could use the one I used to start with Raspberry Pi Monitoring.